
Lead Generation Metrics: Every Number You Need to Track (and How to Calculate Each One)
Published August 4, 2026
The lead generation metrics that matter, from CPC to cost per SQL, each defined with its formula and one worked example carried through the full funnel.
Lead generation metrics are the numbers that describe how advertising spend becomes customers. Most lists of lead gen KPIs read like glossaries: twenty definitions in alphabetical order, with no sense of which numbers drive decisions or how they relate to each other. This guide takes the other route. It walks the funnel from first impression to closed deal, defines each metric where it appears in the sequence, and carries a single example account through the whole thing: a business spending $10,000 a month on Google Ads. If you want to know how to measure lead generation rather than just name its parts, following one budget through every stage is the fastest way to see how the numbers connect.
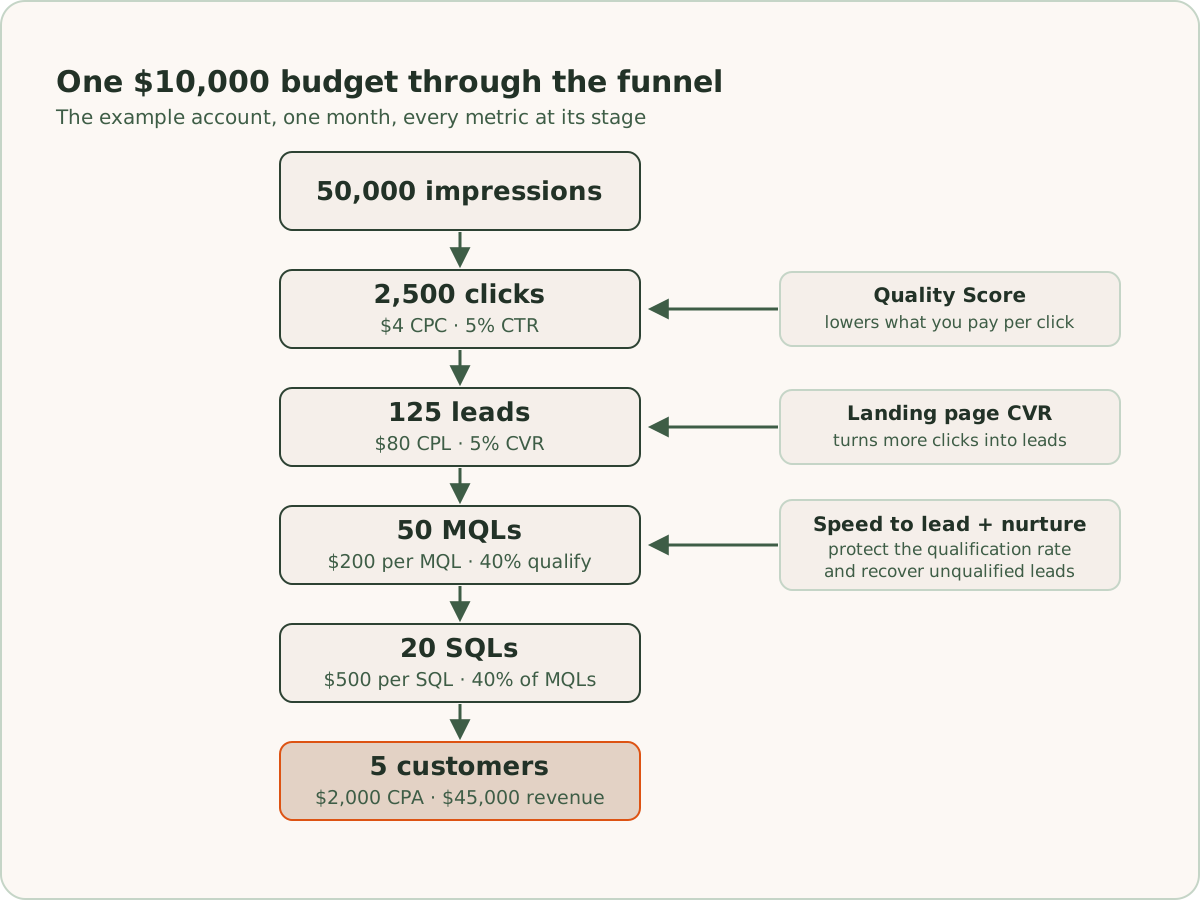
The Funnel Map: Impressions, Clicks, and CPC
Three numbers describe what happens before a lead exists. Impressions count how many times your ads were shown. Click-through rate (CTR) is clicks divided by impressions: the share of people who saw the ad and clicked it. Cost per click (CPC) is spend divided by clicks: the price of one visitor.
Set the example in motion. The $10,000 budget buys 50,000 impressions in a month. At a 5% CTR, that's 2,500 clicks, and $10,000 across 2,500 clicks is a $4 average CPC.
None of these are goals. Nobody should manage a lead generation account to impressions, and raw CTR matters mostly relative to your own history on your own keywords. These numbers make the list because every cost metric downstream decomposes into them. When cost per lead moves, the explanation always traces back to what you paid for clicks or what those clicks did next, and the trace runs through this layer.
Cost Per Lead: The First Output Metric
Cost per lead is what you pay in advertising to generate one lead. Divide total ad spend by the number of leads it produced.
CPL = total ad spend / leads generated
In the example account, the 2,500 clicks convert at 5%, which produces 125 leads. $10,000 divided by 125 is an $80 cost per lead.
The same number has a second formula, and it's the one to memorize:
CPL = CPC / conversion rate
$4 divided by 0.05 is $80. The two forms give the same result but do different jobs. Spend over leads reports the outcome. CPC over conversion rate tells you where to look when the number changes, because those two terms are CPL's only moving parts.
Most dashboards stop at CPL, and that's the problem. CPL tells you what happened. It doesn't tell you why, and it doesn't tell you whether those leads were worth buying. The 125 leads in this example include everyone who submitted a form or called a tracked number: buyers with budget, job applicants, students collecting quotes, the occasional bot. What the average hides, and the diagnostic path we run when CPL moves, get full treatment in our guide to cost per lead.
The Qualified Stages: MQL, SQL, and the Rate Between Them
The metrics that support budget decisions start here, because they filter the junk out of the denominator before you divide.
A marketing qualified lead (MQL) is a lead that passed your written qualification bar: right service area, real project, working contact information, whatever criteria you and your sales team agreed define a lead worth pursuing. Say sales reviews the 125 leads and accepts 50. That's a 40% qualification rate, and it produces the first metric we trust more than CPL:
Cost per MQL = ad spend / MQLs = $10,000 / 50 = $200
Two campaigns with identical CPLs can have very different costs per MQL, because cheap clicks tend to qualify at lower rates. That's why we treat cost per MQL as the budget allocation metric and CPL as an efficiency check. The full case for the metric, and the tracking needed to compute it by campaign, is in our cost per MQL guide.
A sales qualified lead (SQL) is a lead sales has vetted directly and accepted for active pursuit, usually after a first conversation. In the example, 20 of the 50 MQLs clear that bar.
MQL to SQL rate = SQLs / MQLs = 20 / 50 = 40%
Cost per SQL = $10,000 / 20 = $500
The MQL to SQL rate is the health check on the handoff between marketing and sales. When it falls, either marketing's bar drifted looser or sales changed what it accepts, and the two teams are usually pointing at each other by the time anyone reads the number. Written definitions prevent most of that argument; where to draw the line between MQL and SQL covers how to set them and who owns each side.
One caution that applies to everything from here down: counts shrink at each stage, so the numbers get noisier. 125 leads support weekly decisions. 20 SQLs might need a quarter before a trend means anything. Our working rule is to make decisions on the deepest stage that still has enough volume to read, and to treat everything below it as a directional check.
Lead Quality Instrumentation: Scoring and Offline Conversions
Everything in the previous section assumes qualification data exists and can be traced back to the spend that produced it. That takes two pieces of infrastructure, and most accounts we take over have neither.
The first is lead scoring. We score progressively rather than pass or fail: a lead is worth $1 at first inquiry, and its value steps up as it clears each stage, all the way to full contract value when the deal closes. MQL and SQL are rungs on that ladder rather than separate systems, which keeps the definitions consistent between reporting and bidding. If you're building your first scoring model, our introduction to lead scoring starts from zero.
The second is offline conversion tracking, the pipe that carries those scores back into Google Ads. For form leads, the landing page captures the GCLID (Google's unique click identifier) in a hidden field and stores it on the CRM record with the lead. When the lead's score changes, an automation sends the GCLID and the updated value back to Google Ads, which credits the conversion to the exact campaign, ad group, and keyword that produced the click. The setup for form leads takes about a day on most stacks.
Phone calls need their own version, because a caller never touches a form. Call tracking software assigns each ad click a dynamic phone number, ties the call to the click that displayed it, and feeds the call into the same scoring flow. In many of the industries we serve, a large share of leads arrive by phone, so skipping this step means computing cost per MQL on a fraction of your actual leads and letting Google bid on incomplete data. The phone call version of the setup covers the numbers, the duration filters, and the upload.
The payoff goes beyond reporting. Once scored conversions flow in, Smart Bidding optimizes toward the clicks that qualify instead of raw form fills, which is the difference between buying cheap leads and buying good ones.
Speed to Lead: The Clock Between Marketing and Sales
Speed to lead is the elapsed time between a lead's arrival and the first contact attempt. Measure it from CRM timestamps (lead created, first call or reply logged) and report the median, because averages hide the leads that sat overnight.
It belongs on this list because it changes the value of every lead you already bought. The 125 leads in our example cost $80 each whether someone calls them in four minutes or four hours, but the odds of reaching a person, and reaching them before a competitor does, fall as the clock runs. A slow response quietly lowers the qualification rate, which raises cost per MQL without anything changing in the ad account. That mechanism, and how to automate the first response so it never depends on who happens to be near a phone, is in our speed to lead article.
The first response is also the front end of follow-up. In the example account, 75 leads didn't qualify on first contact, and some fraction of those are real buyers who weren't ready yet. If an email and SMS nurture sequence converts five of them into MQLs over the following weeks, the account now has 55 MQLs from the same spend, and cost per MQL drops from $200 to about $182 with no changes to bids, keywords, or ads.
The Efficiency Drivers: Conversion Rate and Quality Score
Return to the diagnostic formula: CPL equals CPC divided by conversion rate. Every improvement to cost per lead arrives through one of those two terms, so each deserves its own instrumentation.
Conversion rate is leads divided by clicks, and it's the website's contribution to the ad account. The example converts 5% of its 2,500 clicks. Push that to 6% and the same $10,000 produces 150 leads at about $67 each, a 17% CPL improvement earned entirely on the page. The two highest-leverage inputs are dedicated landing pages instead of general site pages and message match between the ad and the page: a visitor who clicked an ad about water heater replacement should land on a page about water heater replacement, not a plumbing homepage.
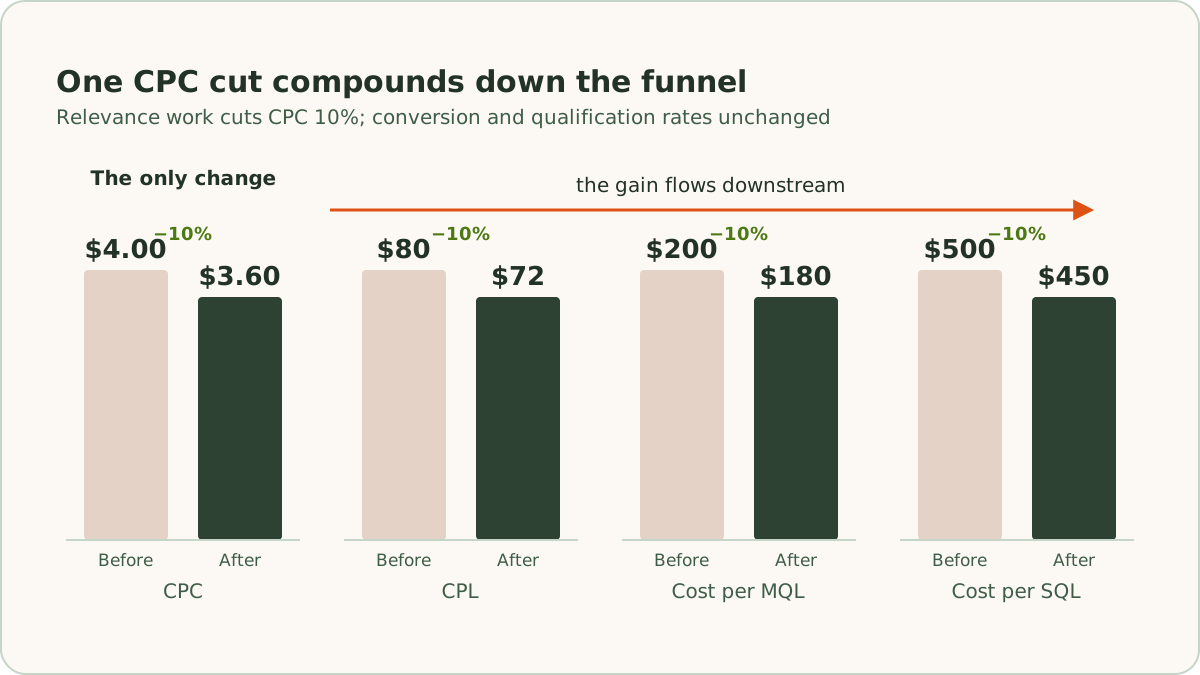
Quality Score works the CPC term. Google grades every keyword on Expected CTR, Ad Relevance, and Landing Page Experience, and better grades lower what you pay per click at the same position. If relevance work brings the example account's average CPC from $4.00 to $3.60, CPL falls from $80 to $72 at the same conversion rate, and the gain compounds through every downstream metric: cost per MQL drops to $180, cost per SQL to $450. The mechanics of how Quality Score lowers cost per lead get their own article.
Working Backwards: Your Maximum CPL
Every metric so far measures what happened. Add deal economics and you can compute what's allowed to happen: the highest CPL at which advertising still makes money.
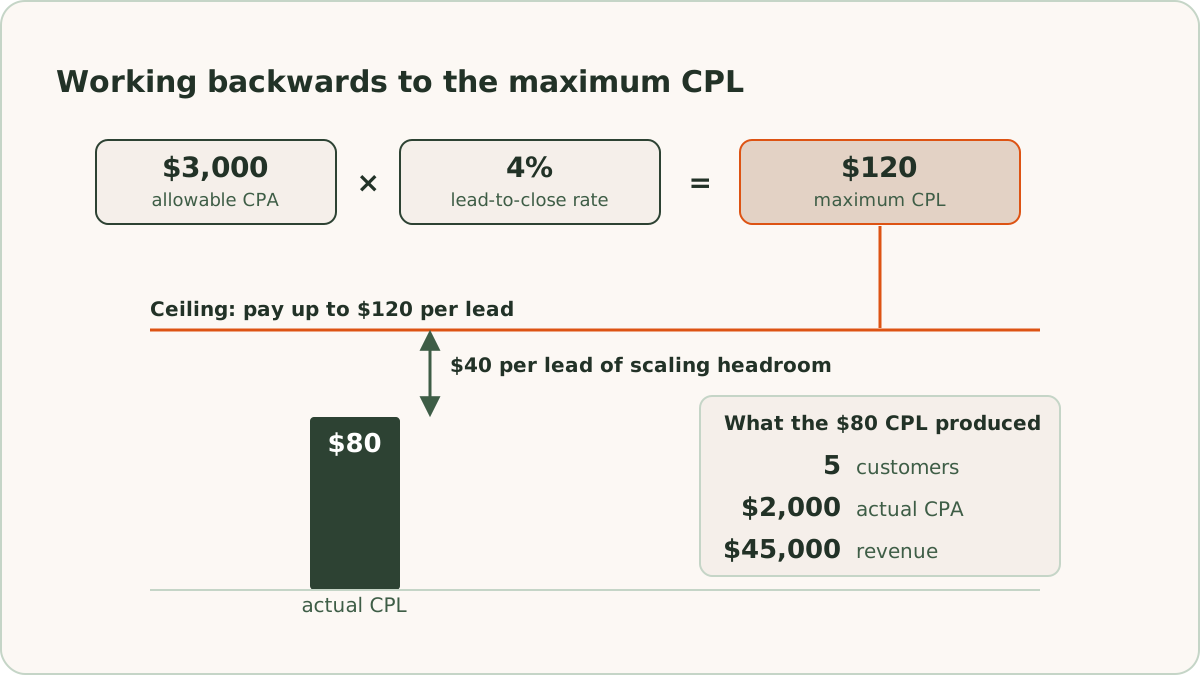
Two inputs. First, your allowable cost per acquisition, meaning what you're willing to pay for one new customer. Say the example business closes deals worth $9,000 on average and will spend up to a third of first-deal revenue on acquisition: a $3,000 maximum CPA. Second, your lead to close rate. In the example, 5 of the 125 leads become customers over the sales cycle, a 4% close rate.
Maximum CPL = allowable CPA x lead to close rate = $3,000 x 0.04 = $120
At an actual CPL of $80, the account is operating well inside its ceiling: the $10,000 produced 5 customers (a $2,000 actual CPA) and $45,000 in revenue. The ceiling also answers the scaling question. This account can absorb rising marginal costs up to $120 per lead before growth stops paying, so the decision to raise budget can be checked against a number instead of debated. Our cost per lead calculator runs this backwards calculation from your own deal size, close rate, and margin.
How We Report Lead Generation Metrics
A list of metrics becomes a reporting system with three rules. This is how we run it across the $10.75M in ad spend we've managed over the last 12 months.
One number per stage. Each funnel stage gets one cost metric: CPL, cost per MQL, cost per SQL, cost per acquisition. The supporting metrics (CTR, CPC, conversion rate, Quality Score, speed to lead) appear when they explain a change and stay out of the report when they don't. If a number doesn't explain what moved or change what we do next, it doesn't make the page.
Decomposition when a number moves. A report that says cost per MQL rose 20% has described a symptom. Ours name the term that moved: CPC or conversion rate for a CPL change, qualification rate or campaign mix for a cost per MQL change. We also separate cause from byproduct. If conversion rate fell and Smart Bidding pulled delivery back in response, fewer clicks is a consequence of the problem, not a second problem.
The CRM is the source of truth. Google Ads knows about clicks and whatever conversions it was told about. The CRM knows what each lead became. When the two disagree, the CRM wins and the gap goes on the fix list, because every qualified-stage metric is only as good as the pipe feeding it. Month-end numbers read from the CRM's stage counts; the ad platform's job is to receive that data back for bidding, not to arbitrate it.
One Funnel, One Calculation
Walk the example account end to end and the metrics chain together: $10,000 bought 2,500 clicks at $4, which became 125 leads at $80, 50 MQLs at $200, 20 SQLs at $500, and 5 customers at $2,000 against a $3,000 allowance, returning $45,000 in revenue. Every number in that chain is a checkpoint you can instrument, and every upstream improvement compounds through the rest.
Building the system behind the numbers (campaigns, dedicated landing pages, lead scoring, offline conversions, nurture) is the work of our Google Ads management for lead generation service. We've generated 5,000+ leads and $250M+ in revenue for 35+ lead generation businesses measured exactly this way, and the reporting described above is the reporting clients get.
Frequently Asked Questions
Quick answers to the questions readers ask most about this topic.
One cost number per funnel stage and the rates between stages: cost per lead, cost per MQL, cost per SQL, MQL to SQL rate, and cost per acquisition, plus conversion rate, Quality Score, and speed to lead as the levers behind them. Reconcile all of them against your CRM, not the ad platform alone.
Divide total ad spend by the number of leads it produced. If you spent $10,000 and generated 125 leads, your cost per lead is $80. The same number also equals average cost per click divided by conversion rate, which is the more useful form when you need to diagnose why CPL changed.
There is no universal benchmark. Work backwards from your own economics: decide what you can afford to pay for one new customer, multiply that by your lead to close rate, and the result is your maximum viable CPL. Any CPL below that ceiling is good for your business, whatever other industries pay.
A marketing qualified lead has passed a written qualification bar: right service area, real project, valid contact information. A sales qualified lead has been vetted by sales directly and accepted for active pursuit, usually after a first conversation. Both definitions need to be agreed on in writing, because the handoff between the stages is where most measurement disputes start.

Written by
Founder & CEO, ReClick.io
Corey runs Google Ads, landing page, and email nurture programs for lead generation businesses across the United States and Canada.
Keep Reading
Offline Conversion Tracking for Phone Calls: Stop Optimizing to Dial Clicks
Call tracking connects phone leads to the Google Ads clicks that produced them, so you can bid toward qualified conversations instead of dial clicks.
Offline Conversion Tracking in Google Ads: Feed Closed Deals Back Into Your Bidding
Offline conversion tracking sends closed deals from your CRM back to Google Ads so Smart Bidding can optimize for revenue instead of form fills.
How Quality Score Lowers Your Cost Per Lead (the Mechanism, Step by Step)
Quality Score is a pricing input, not a report card. See how each component changes your actual CPC and how cheaper clicks flow through to lower cost per lead.