
What Is Cost Per Lead? The CPL Formula, Worked Examples, and What It Hides
Published June 3, 2026
Cost per lead is easy to calculate and easy to misread. Both CPL formulas, a worked example, what the average hides, and how we diagnose a CPL change.
Cost per lead is usually the first metric a lead generation business tracks, and the one most likely to be misread. The formula is simple, the arithmetic takes seconds, and the result looks authoritative on a dashboard. But an $80 cost per lead can describe a healthy account or a failing one, and the number alone won't tell you which. This article covers how to calculate cost per lead both ways, carries one worked example through the whole funnel, and walks through what we check before deciding whether a CPL is good.
What Cost Per Lead Measures
Cost per lead (CPL) is what you pay in advertising to generate one lead. A lead here means a person who raised a hand: submitted a form, called a tracked number, booked a consultation, started a chat that captured contact details. CPL measures the cost of that first signal and nothing after it. It says nothing about whether the person has budget, fits your service area, or answers the phone when sales follows up.
Used within that scope, CPL is a solid operating metric. It lets you compare campaigns on equal footing, budget toward a target lead volume, and catch efficiency problems early. Used as a proxy for pipeline health, it fails quietly, because two accounts with identical CPLs can produce very different revenue. Across the 35+ lead generation businesses we've managed ads for, the accounts that got into trouble were rarely the ones ignoring CPL. They were the ones optimizing it in isolation.
How to Calculate Cost Per Lead: Two Formulas
The standard CPL formula divides spend by lead count:
CPL = total ad spend ÷ leads generated
If you spent $8,000 last month and generated 100 leads, your cost per lead is $80. That's the version every dashboard shows, and it answers exactly one question: what did a lead cost during this window.
There's a second formula, and it's the one we reach for when diagnosing an account:
CPL = cost per click ÷ conversion rate
It's the same math rearranged. Spend equals clicks times CPC. Leads equal clicks times conversion rate. Divide one by the other and clicks cancel out. Run the same example through it: $8,000 bought 2,000 clicks at a $4 average CPC, and 100 of those 2,000 clicks converted, a 5% conversion rate. $4 divided by 0.05 is $80. Same answer.
The difference is what each version is good for. Spend divided by leads tells you what happened. CPC divided by conversion rate tells you where to look next, because it splits CPL into its only two moving parts: what you pay for a click and how often a click becomes a lead. Every CPL change in every account traces back to one or both of those. If you want to run your own numbers through both versions, our cost per lead calculator handles the arithmetic and the breakdown.
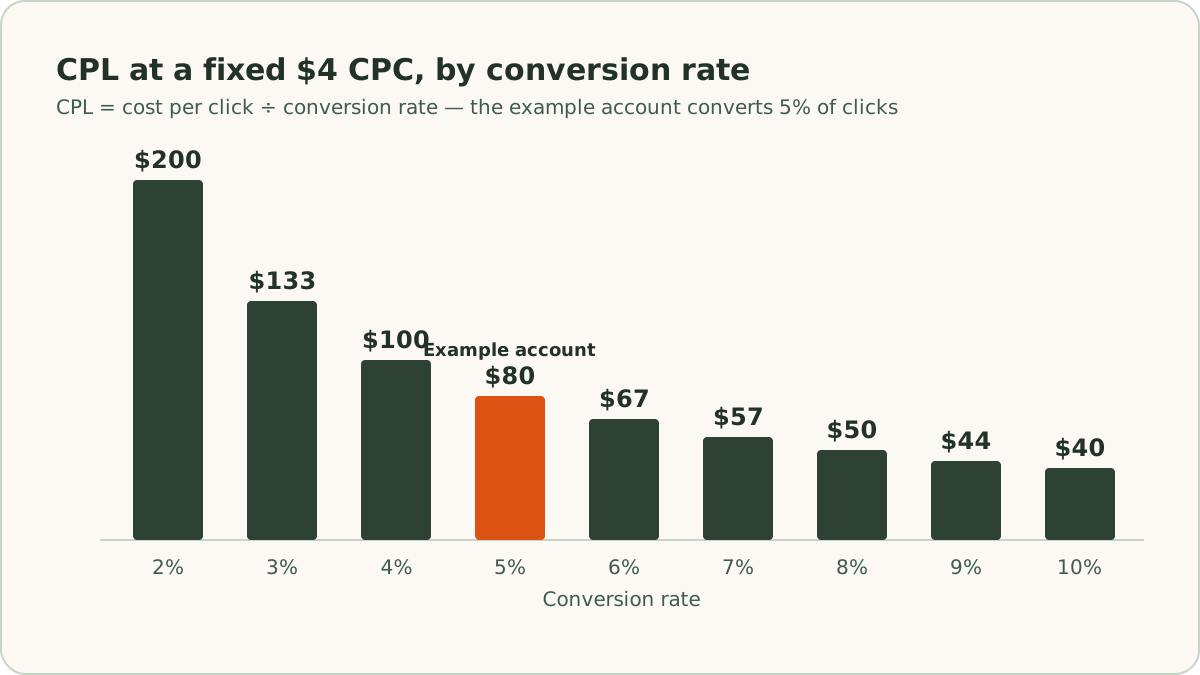
We'll keep this example account for the rest of the article: $8,000 in spend, 2,000 clicks, $4 CPC, 5% conversion rate, 100 leads, $80 CPL.
What CPL Hides
Lead Quality Is Invisible in the Average
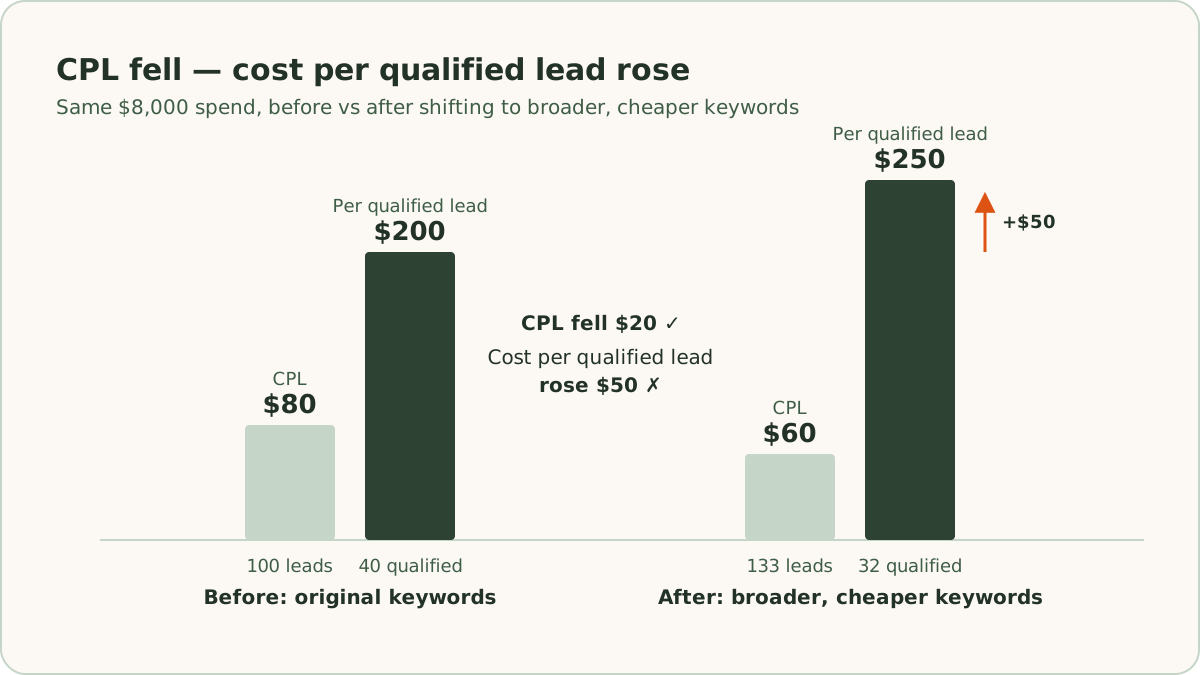
Each of the 100 leads in our example costs $80 in the average, whether it's a homeowner ready to book or a student doing research for a class. Suppose sales works the list and 40 of the leads turn out to be qualified: real need, real budget, inside the service area. Your cost per qualified lead is $8,000 divided by 40, or $200. That number is two and a half times your CPL, and it's the one that predicts revenue.
Now suppose an optimization drops CPL from $80 to $60 by shifting spend toward broader, cheaper keywords. The same $8,000 now buys 133 leads. But if the qualification rate falls from 40% to 24%, you have 32 qualified leads instead of 40, and your cost per qualified lead rose to $250 while your CPL improved. On the dashboard this looks like a win. In the pipeline it's a 20% cut to the leads that matter, at a higher unit cost.
The Sales Cycle Lags the Report
CPL is an instant metric. Revenue is not. A lead that arrives on the 28th counts toward this month's CPL and, for many of the businesses we work with, won't become a customer for 30 to 90 days. When you evaluate a campaign change on two weeks of CPL data, you're grading the cost side in full and the value side not at all. This lag is one reason we hold experiments open until results are stable and label early reads as directional instead of treating them as verdicts.
Campaign Mix Shifts the Blend
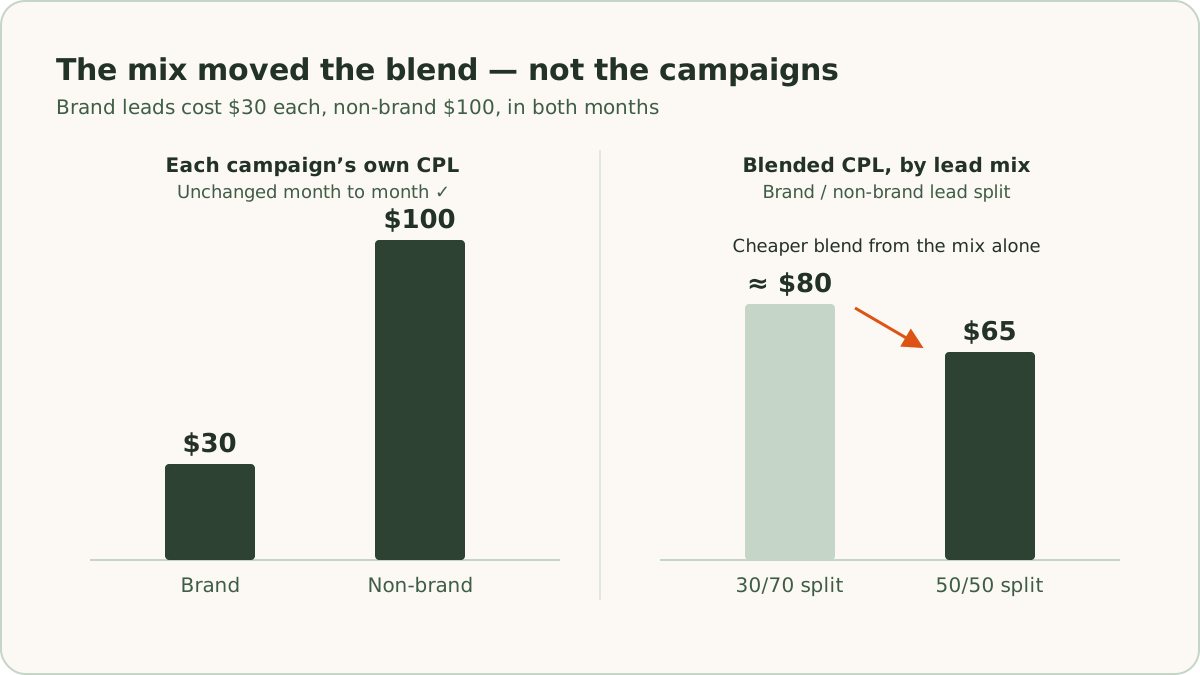
Blended CPL moves when the mix moves, even if nothing got better or worse. Suppose our example account is really two campaigns: a branded campaign producing leads around $30 each and a non-brand campaign producing them around $100. At a 30/70 lead split, the blend lands near $80. If brand search volume rises one month and the split shifts to 50/50, blended CPL drops to about $65 with zero change in the efficiency of either campaign. The reverse happens too: a spend increase that correctly pushes more budget into non-brand will raise blended CPL while doing exactly what it should. Always read CPL by campaign before reading it in aggregate.
The Conversions You Count Change the Number
CPL also depends on which conversions you allow into the denominator. Google Ads reports last-click conversions by default: the lead is credited to the campaign that received the final click before the form went in. Bottom-of-funnel campaigns like branded search naturally look great on that basis, because they close. Top-of-funnel campaigns rarely get the final click. A user watches a video ad, comes back three days later through a branded search, and converts. Branded search gets the last-click lead. The video campaign gets an assisted conversion, or a view-through conversion if the user never clicked at all, and neither shows up in the standard conversions column. Judge those campaigns on last-click CPL alone and they look expensive while they may be feeding the campaigns that look cheap. We treat last-click as the strongest signal, assisted conversions as strong, and view-throughs as directional, and we read top-of-funnel CPL against all three rather than any single column.
Why We Report CPL Alongside Cost Per Qualified Lead
Because the average hides quality, we never let CPL stand alone in client reporting. Every lead gen account we manage reports CPL next to cost per MQL, so the two numbers can disagree in public. When they diverge, the divergence is the finding: cheaper leads that qualify less often are not cheaper.
The mechanics behind this matter. We score leads progressively, starting at $1 when an inquiry first comes in and stepping the value up as the lead advances, all the way to full contract value when a deal closes. Those values get uploaded back into Google Ads as offline conversions across a 90-day window. That does two things. It gives Google's bidding the same quality information we report on, so the algorithm optimizes toward qualified leads rather than raw form fills. And it means the CPL column and the qualified-lead column come out of the same system, instead of being reconciled from a spreadsheet at the end of the month.
Go back to the $60 CPL example above. With scored offline conversions flowing in, that shift toward broader keywords shows up as falling conversion values within a few weeks, and we catch it before a quarter of budget goes into leads that never close.
How We Break Down a CPL Change
This is where the second formula becomes useful. When CPL moves in an account we manage, the client report doesn't say "CPL rose 25%" and stop. It names the cause. We get there with a fixed diagnostic path, run the same way every time, across the $10.75M in ad spend we've managed over the last 12 months.
Step one: which side moved. CPL is CPC divided by conversion rate, so one of those two moved. Say our example account's CPL rises from $80 to $100. If CPC held at $4 and conversion rate fell from 5% to 4%, the problem is on the conversion side. If conversion rate held and CPC rose from $4 to $5, the price of traffic went up.
If CPC moved: we check impression share lost to rank against impression share lost to budget. Lost to budget means the account is constrained and paying peak-hour prices. Lost to rank points at relevance, which is where Quality Score lives. We grade it per keyword as Below Average, Average, or Above Average across its three components (Expected CTR, Ad Relevance, Landing Page Experience) and audit it by mapping each keyword to the final URL it serves. The mechanics of that connection are their own topic, covered in how Quality Score lowers cost per lead.
If conversion rate moved: we ask whether it's the traffic or the page. If CTR dropped alongside conversion rate, the click mix changed: search terms drifted, a match type broadened, a competitor changed the auction. If CTR held and visitors simply stopped converting, the page is the suspect: a form change, a speed regression, an offer that no longer matches the ad. Conversion problems also concentrate; they rarely spread evenly across an account. That's part of why we build dedicated landing pages for our top-spending ad groups first instead of sending paid traffic to general site pages, and why we keep message consistency from keyword to ad to page.
Step two: separate cause from byproduct. Some metrics look like causes but are downstream effects. If lead volume fell and clicks fell too, it's tempting to report a traffic problem. But if conversion rate dropped first and smart bidding pulled back delivery in response, fewer clicks is a byproduct. We report the cause, not the chain of effects that followed it.
The report itself follows a three-part structure: here's what happened, here's why it happened, here's what we're doing next. Exact dollar figures, percentage changes rounded to the nearest point, and a filter on every number: if a metric doesn't explain the CPL move or change what we do next, it doesn't make the report.
Lowering CPL Without Wrecking Lead Quality
The safe levers all improve the account rather than dilute it. Raising Quality Score lowers CPC for the same clicks. Fixing or building landing pages raises conversion rate on traffic you already bought. Cutting wasted spend through search term audits and negatives removes clicks that were never going to convert. None of these change who you're attracting; they change what you pay to attract them.
The risky lever is loosening targeting to buy cheaper clicks, which usually trades quality for volume, as the worked example showed. Our guardrail is simple: any change that improves CPL gets checked against cost per qualified lead before we call it a win. We also write a causal hypothesis before launching any experiment, not "testing new headlines" but "testing new headlines because we expect ad relevance to improve, which should lower CPC." If CPL falls and we can't trace the drop to the mechanism we predicted, we keep digging before we scale it.
What an $80 CPL Is Worth
The formula takes ten seconds: spend divided by leads, or CPC divided by conversion rate when you need to know which lever moved. The judgment takes longer, because CPL only means something next to lead quality, sales cycle timing, campaign mix, and the conversions you chose to count. If you'd rather have that whole loop run for you, from campaigns to landing pages to lead scoring, that's the work of our Google Ads management for lead generation service, reported the same way it's described here.
Frequently Asked Questions
Quick answers to the questions readers ask most about this topic.
Cost per lead (CPL) is what you pay in advertising to generate one lead: a form submission, a tracked phone call, a booked consultation, or a chat that captured contact details. It measures the cost of that first hand-raise and nothing after it, so it says nothing about whether the lead has budget, fits your service area, or answers the phone.
Divide total ad spend by the number of leads it generated. If you spent $8,000 last month and got 100 leads, your cost per lead is $80. There is a second version of the formula, cost per click divided by conversion rate, and it is more useful for diagnosis because it splits CPL into its only two moving parts: what you pay for a click and how often a click becomes a lead.
The number alone cannot tell you. An $80 CPL can describe a healthy account or a failing one, because the average hides lead quality, sales cycle lag, and campaign mix. Judge CPL next to cost per qualified lead: if cheaper leads qualify less often, they are not cheaper.
CPL is cost per click divided by conversion rate, so one of those two moved. If CPC rose, check impression share lost to rank versus lost to budget, which separates a relevance problem from a constrained budget. If conversion rate fell, ask whether the traffic changed (search terms drifted, a match type broadened) or the page stopped converting (a form change, a speed regression, an offer that no longer matches the ad).

Written by
Founder & CEO, ReClick.io
Corey runs Google Ads, landing page, and email nurture programs for lead generation businesses across the United States and Canada.
Keep Reading
Lead Generation Metrics: Every Number You Need to Track (and How to Calculate Each One)
The lead generation metrics that matter, from CPC to cost per SQL, each defined with its formula and one worked example carried through the full funnel.
Offline Conversion Tracking for Phone Calls: Stop Optimizing to Dial Clicks
Call tracking connects phone leads to the Google Ads clicks that produced them, so you can bid toward qualified conversations instead of dial clicks.
Offline Conversion Tracking in Google Ads: Feed Closed Deals Back Into Your Bidding
Offline conversion tracking sends closed deals from your CRM back to Google Ads so Smart Bidding can optimize for revenue instead of form fills.