
How Quality Score Lowers Your Cost Per Lead (the Mechanism, Step by Step)
Published June 17, 2026
Quality Score is a pricing input, not a report card. See how each component changes your actual CPC and how cheaper clicks flow through to lower cost per lead.
Quality Score Is a Pricing Input, Not a Report Card
Quality Score is Google's 1 to 10 estimate of how relevant your keyword, ad, and landing page are to the person searching. Most advertisers treat it as a health metric, something to glance at when performance dips. It's more useful to treat it as a pricing input, because that's how Google uses it. In every auction, the quality of your ad and page helps decide both where you rank and what you pay for the click. Two advertisers can bid the same amount on the same keyword and pay meaningfully different prices for the same position.
The chain from quality to price runs in one direction. Better component ratings raise your ad rank. Higher ad rank per dollar of bid lowers your actual CPC. And a lower CPC flows directly into a lower cost per lead. This article walks through that mechanism step by step, then covers how we audit it in the accounts we manage.
The Three Components, Graded Per Keyword
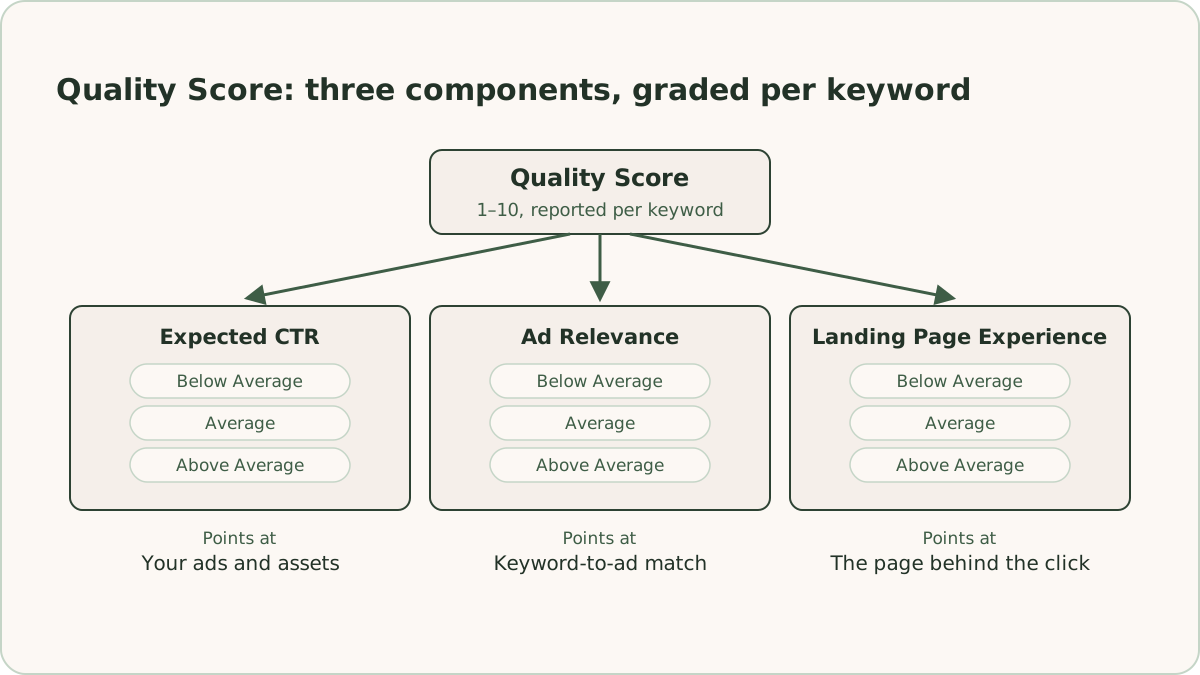
Google reports Quality Score per keyword, and behind the single number sit three components: Expected CTR, Ad Relevance, and Landing Page Experience. Each one is graded Below Average, Average, or Above Average for every keyword in your account. The blended 1 to 10 gets the attention, but the component grades are where the diagnostic value is, because each one points at a different part of your funnel. Expected CTR points at your ads and assets. Ad Relevance points at the match between keyword and ad copy. Landing Page Experience points at the page behind the click.
Expected CTR
Expected CTR is Google's estimate of how likely your ad is to be clicked when it shows for that keyword. It draws on the keyword's historical CTR, how well your ad copy reflects the search term, and the assets attached to your ads. In our accounts, most Expected CTR problems trace back to thin assets and generic copy. We build out the full asset set on every search campaign: sitelinks tailored to each ad group rather than generic About Us links, callouts that carry the ad group's keywords where they fit naturally, images on every ad, business name and logo once advertiser verification is done, and call extensions on lead gen campaigns so the searcher can reach the business with one less click. Bids play a role too. If your bids are too low for your ads to reach prominent positions, Expected CTR suffers regardless of how good the ad is.
Ad Relevance
Ad Relevance measures how closely your ad matches the intent behind the search, not whether the search term literally matches your keyword. A keyword can be an exact string match to the query and still earn a Below Average rating if the ad speaks to a different intent. We manage this with tight, single-theme ad groups: three to five headlines in each responsive search ad that directly reflect the terms we want to show for, phrase and exact match while an account is young so we control which queries we enter, and dynamic keyword insertion where it produces a natural headline. When one ad group accumulates keywords with diverging intent, we split it rather than trying to write one ad that covers both.
Landing Page Experience
Landing Page Experience is Google's read on how relevant and useful your page is to the person who clicked. Google crawls the final URL and checks whether the page copy reflects the search terms the keyword serves, alongside behavioral signals like whether visitors bounce or convert, plus load speed, mobile usability, and basic security like SSL. This is the component we see fail most often in lead generation accounts, usually because every keyword in the account points at the same homepage. More on that below, because the landing page carries more of the CPL mechanism than any other single piece.
How Quality Score Affects Your CPC
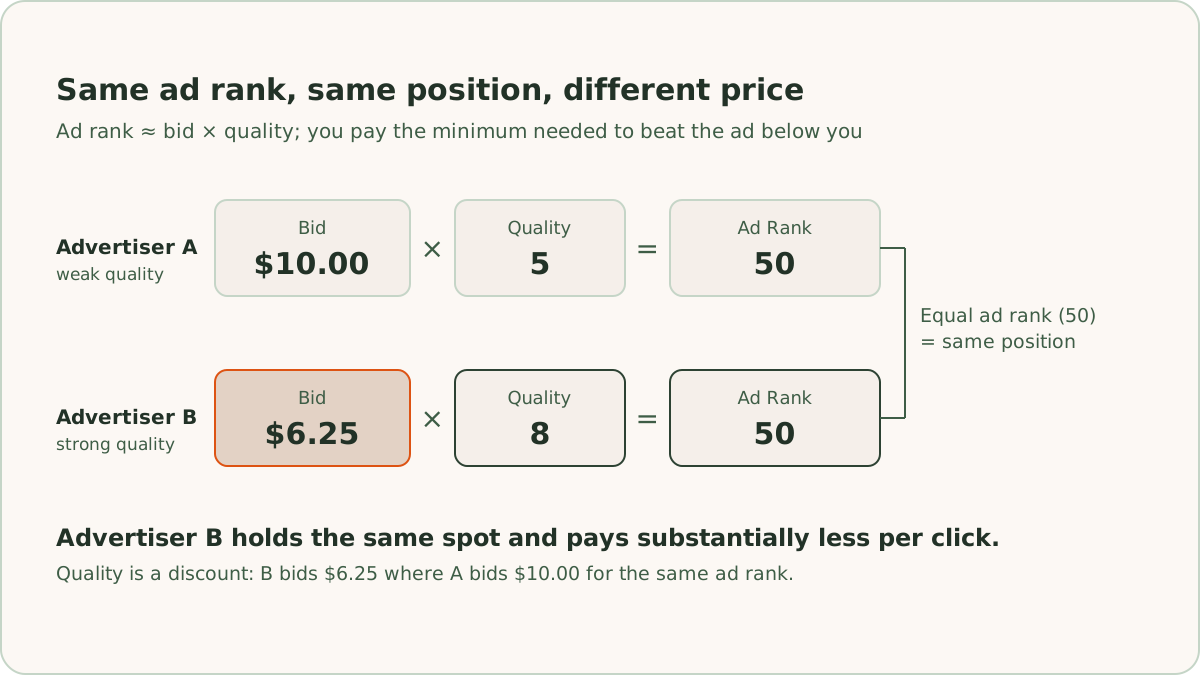
In every auction, Google calculates an ad rank for each eligible ad. The full calculation includes your bid, the quality of your ad and landing page at auction time, the expected impact of your assets, and context like device and location. The useful simplification is that ad rank is roughly bid multiplied by quality, and what you pay is set by the minimum needed to beat the advertiser ranked below you, not by your bid ceiling.
That structure is what makes quality a discount. As a simplified example: advertiser A bids $10.00 on a keyword with weak quality, call it a 5, for an ad rank of 50. Advertiser B bids $6.25 with strong quality, call it an 8, for the same ad rank of 50. They hold the same position, and B pays substantially less per click for it. Run that across thousands of clicks a month and the gap compounds into a real budget difference.
One caveat worth knowing: the 1 to 10 score you see in the interface is a rolled-up, per-keyword summary. The pricing itself happens per auction, using real-time signals about the device, location, time of day, and searcher. So the visible score is a proxy, and it can lag your changes. The reason to improve the inputs behind it is that those same inputs feed the auction-time calculation that sets your price.
From a Cheaper Click to a Cheaper Lead
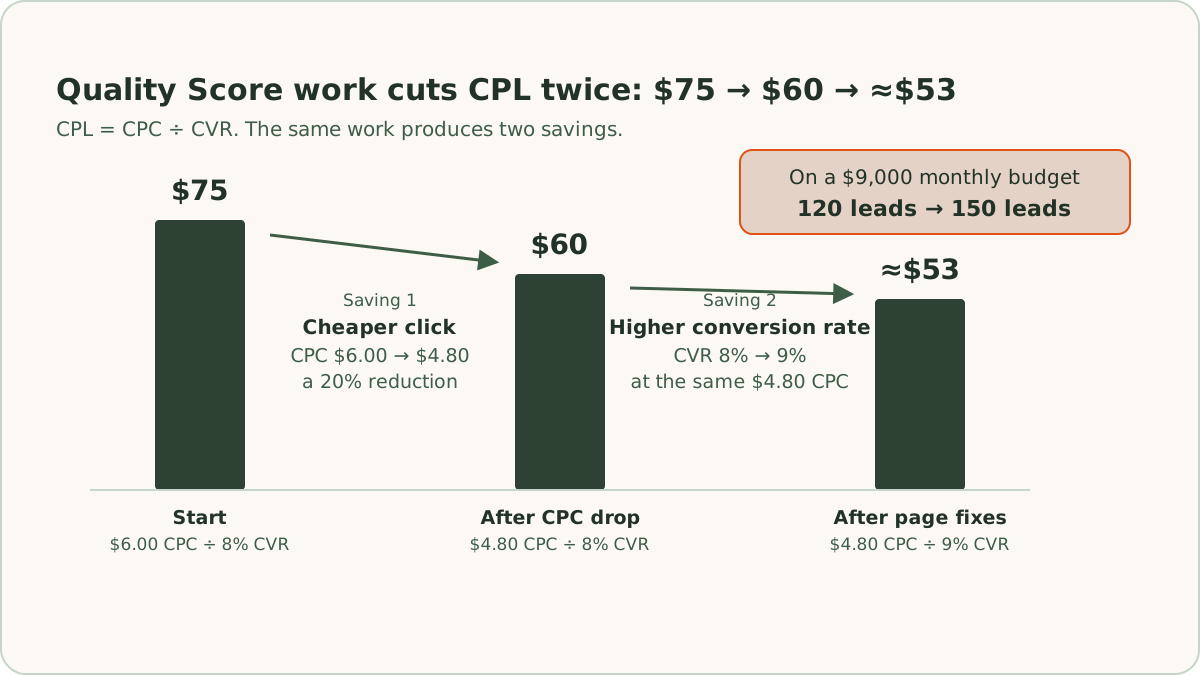
Cost per lead is cost per click divided by conversion rate: CPL = CPC / CVR. That identity is why Quality Score work shows up on the lead line, and it's worth running the numbers as an example.
Say a campaign pays $6.00 per click and the landing page converts 8% of visitors into leads. CPL is $6.00 / 0.08, or $75. Now suppose Quality Score improvements bring the average CPC down 20% to $4.80 with nothing else changing. CPL drops to $60. On a $9,000 monthly budget, that's the difference between 120 leads and 150 leads for the same spend.
The second effect is the one most advertisers miss. The work that improves Landing Page Experience, a faster page whose copy matches the search, tends to improve conversion rate as well. If the page fixes lift CVR from 8% to 9% while CPC sits at $4.80, CPL falls to roughly $53. The same work produces two savings: a cheaper click in the auction and a higher conversion rate on the page. This double effect is why we treat landing pages as part of Google Ads management rather than a separate project.
Why the Landing Page Is Half the Mechanism
Because Landing Page Experience feeds Quality Score and the page's conversion rate feeds CPL directly, the page sits on both sides of the CPL equation. It's also where message consistency either holds or breaks. Google is checking whether the page reflects the search term, and the visitor is checking the same thing in the first few seconds. When someone searches for a specific service, clicks an ad promising that service, and lands on a generic homepage, both checks fail at once. We keep one thread running from keyword to ad to page, and we've written up how we do that in ad-to-page message match.
The practical implication is that most lead gen accounts need dedicated landing pages, not deeper links into the main site. We build them for the top-spending ad groups first, because that's where a Landing Page Experience problem costs the most money, and we work down the spend ranking from there. The case for dedicated landing pages over your website is its own article, but it comes down to control: one page per offer, copy written against the ad group's keywords, one conversion action, and load speed we manage directly. The basics carry real weight here too. Keep load times short, make the page work cleanly on mobile, keep forms simple, put contact information and trust signals like reviews where they're visible, and skip intrusive pop-ups.
How We Audit Quality Score, Dollar-Weighted
A list of low-scoring keywords isn't an audit. A 3 out of 10 on a keyword spending $40 a month barely matters, while an Average rating on a keyword spending $4,000 a month might be the biggest lever in the account. Our audit process weights every problem by money:
- Map every keyword to the final URL it serves. Not the URL you think it serves, the one in the report. Accounts drift, and it's common to find keywords pointed at old pages after a restructure.
- Segment the component ratings by URL. Landing Page Experience problems cluster by page, so grouping keywords by final URL shows immediately which pages are dragging which keywords down.
- Overlay spend. For each URL and each component, total the spend sitting on Below Average ratings. This turns the audit into a ranked list of dollar-weighted problems.
- Fix the biggest number first. If $2,000 of monthly spend sits on Below Average Landing Page Experience for one URL, that page gets rebuilt before anything else gets touched.
We run this as part of our recurring weekly and monthly account checklists rather than as a one-off. Every fix then ships as an experiment with a written causal hypothesis before launch. Not "improving the landing page" but "rewriting the page headline to match the ad group's keywords, because we expect Landing Page Experience to improve, which should lower CPC on the keywords serving that URL." Writing the hypothesis down forces the mechanism to be explicit, and it lets us read the result honestly afterward. We hold experiments until results are stable, and when a read is directional rather than significant, we label it directional. We also avoid launching structural changes during a client's peak season weeks, because a noisy baseline makes the result unreadable.
Improving Quality Score Without Chasing the Number
Quality Score is an output. The moment you start optimizing the number instead of the inputs, you make bad decisions. The most common one is pausing low-scoring keywords that convert profitably. A competitor keyword or a broad category term may never earn Above Average ratings, because your page will never be as relevant to that query as the competitor's own site is. If it produces leads at an acceptable CPL, it stays. The score on that keyword is context, not a verdict.
The discipline that works is narrower: fix the dollar-weighted Below Average ratings where a real mechanism exists to fix them, run each fix as a hypothesis, and measure the result in CPC and CPL rather than in the score itself. The score usually follows, slowly, since it leans on accumulated history. What you're managing is relevance. Does the ad fit the search, and does the page fit the ad. Get those two right and the cheaper clicks follow.
Start With the Keyword-to-URL Report
If you take one action from this article, pull the keyword report with Quality Score components and final URLs, and total the spend sitting on Below Average. That single view tells you whether your CPL problem lives in the ads, the ad groups, or the pages, and how much money is riding on each answer. It's the first report we pull in every audit, across the 35+ lead generation businesses we've worked with and the $10.75M in ad spend we've managed over the last 12 months. If you'd rather have us run the audit and the fixes as one system, that's what our Google Ads management for lead generation is built around.
Frequently Asked Questions
Quick answers to the questions readers ask most about this topic.
Quality Score is Google's 1 to 10 estimate of how relevant your keyword, ad, and landing page are to the person searching. Behind the single number sit three components, each graded Below Average, Average, or Above Average for every keyword: Expected CTR, Ad Relevance, and Landing Page Experience. The component grades carry the diagnostic value, because each one points at a different part of your funnel.
In every auction, ad rank is roughly your bid multiplied by quality, and what you pay is set by the minimum needed to beat the advertiser ranked below you, not by your bid ceiling. An advertiser with strong quality can hold the same position as a weaker competitor at a substantially lower bid, so two advertisers can bid the same amount on the same keyword and pay meaningfully different prices for the same position.
Yes. Cost per lead is cost per click divided by conversion rate, so a lower CPC flows directly into a lower CPL. The work that improves Landing Page Experience, a faster page whose copy matches the search, also tends to lift conversion rate at the same time. The same work produces two savings: a cheaper click in the auction and more leads from the clicks you already buy.
Not if they convert profitably. A competitor keyword or a broad category term may never earn Above Average ratings, because your page will never be as relevant to that query as the competitor's own site is. If it produces leads at an acceptable CPL, it stays. The useful discipline is fixing the dollar-weighted Below Average ratings where a real mechanism exists, and measuring the result in CPC and CPL rather than in the score itself.

Written by
Founder & CEO, ReClick.io
Corey runs Google Ads, landing page, and email nurture programs for lead generation businesses across the United States and Canada.
Keep Reading
Lead Generation Metrics: Every Number You Need to Track (and How to Calculate Each One)
The lead generation metrics that matter, from CPC to cost per SQL, each defined with its formula and one worked example carried through the full funnel.
Offline Conversion Tracking for Phone Calls: Stop Optimizing to Dial Clicks
Call tracking connects phone leads to the Google Ads clicks that produced them, so you can bid toward qualified conversations instead of dial clicks.
Offline Conversion Tracking in Google Ads: Feed Closed Deals Back Into Your Bidding
Offline conversion tracking sends closed deals from your CRM back to Google Ads so Smart Bidding can optimize for revenue instead of form fills.